
Appearance
9. Costs and reports: what the week cost, and why
Back to the case study · Previous: 8. A recall drill · Next: 10. Results and lessons
Every production report is under Manufacturing > Reports, and the same reports under Reports & Analytics > Manufacturing. Each one has a period, totals at the top, and rows that open the order, item or journal behind them.
9.1 Yield and variance: did each run cost what it should?
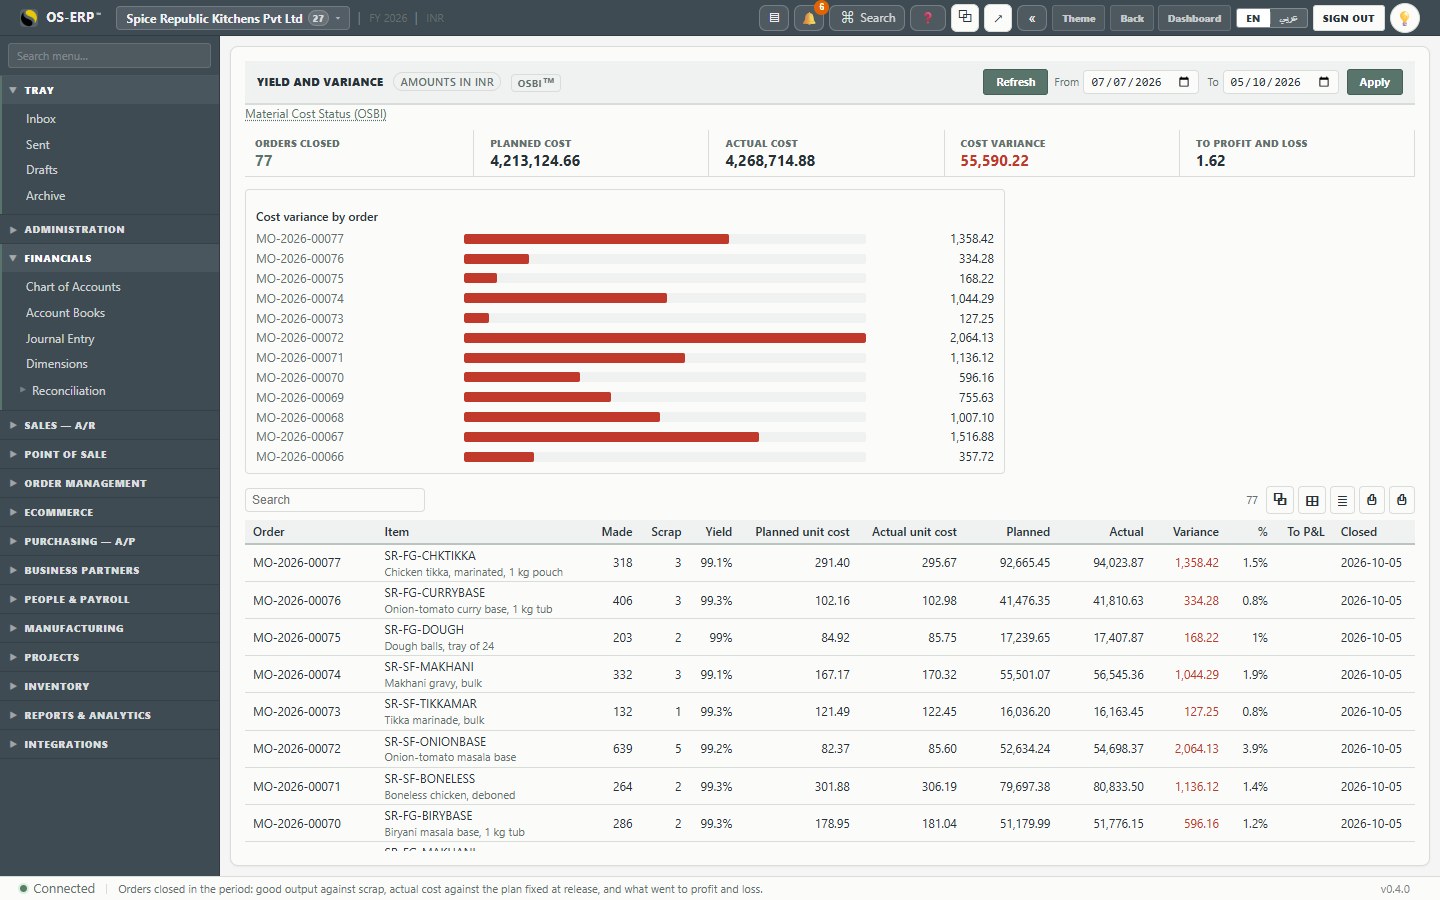
Reports > Yield and variance lists every order closed in the period:
| Column | Meaning |
|---|---|
| Made / Scrap / Yield | Good output, scrap, and good as a share of all output |
| Planned unit cost | Fixed at release: ingredients at the lot costs then, plus routing time at the station rates, less by-products |
| Actual unit cost | What the run really cost per good unit, by-products taken off the same way |
| Variance / % | Actual less planned, in money and as a share |
| To P&L | The part of the variance that could not go onto stock and went to the profit and loss account |
77 orders closed this week: planned INR 4,213,124.66, actual INR 4,268,714.88, a variance of INR 55,590.22 (1.32%). Almost all of it went onto the stock the runs made (it is part of what the packs really cost), and only INR 1.62 to profit and loss.
The bar chart sorts orders by variance. The largest is MO-2026-00072, the onion-tomato base, INR 2,064 over (3.9%): its ingredients went in on recipe (section 9.2 shows it), so the difference is station time. The base's three steps are booked longer than the routing says, night after night. Either the routing's minutes are optimistic and should be raised, or the kettles wait between batches, which is exactly what OEE's changeover finding in chapter 6 says. The onion base runs over every night in this report, which is the signal that it is the routing, not one bad night.
9.2 Material Cost Status: which ingredient, and why
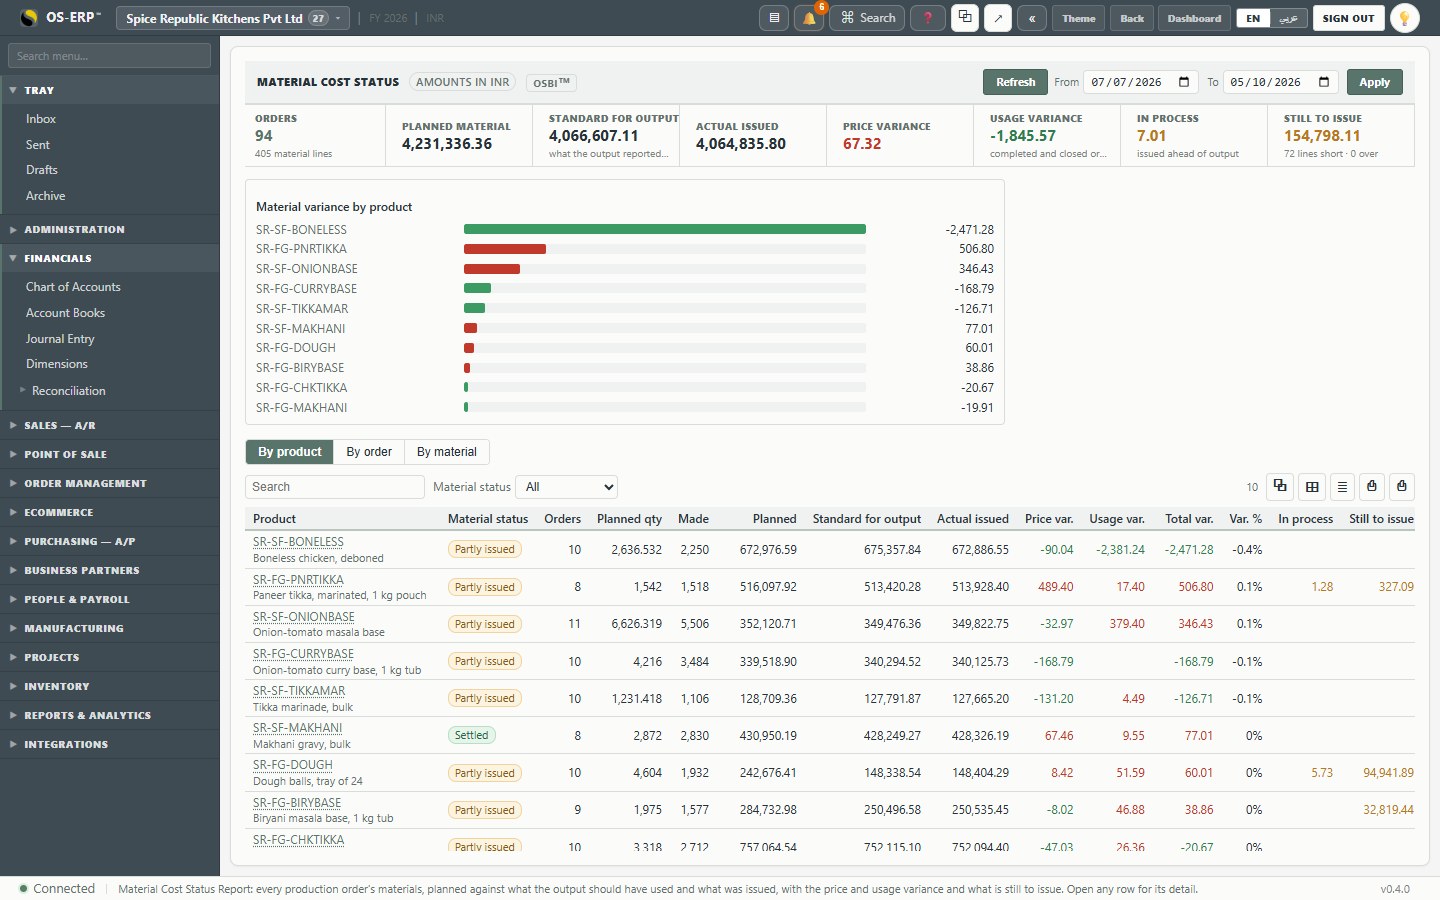
The Material Cost Status Report (MCSR) splits material cost into what it should have been and why it was not. One line is one ingredient on one order; everything above is a sum of lines, so the summary and the detail always agree.
| Figure | Meaning |
|---|---|
| Planned material | Ingredients at the plan fixed at release, for the quantity ordered |
| Standard for output | What the output actually reported should have used, at plan cost |
| Actual issued | What really left the stores, at the lot costs |
| Price variance | The same quantity at a dearer or cheaper lot than planned |
| Usage variance | More or less used than the recipe says (completed and closed orders only) |
| In process | Issued ahead of output on orders still running, which is not a variance yet |
| Still to issue | What open orders will still take |
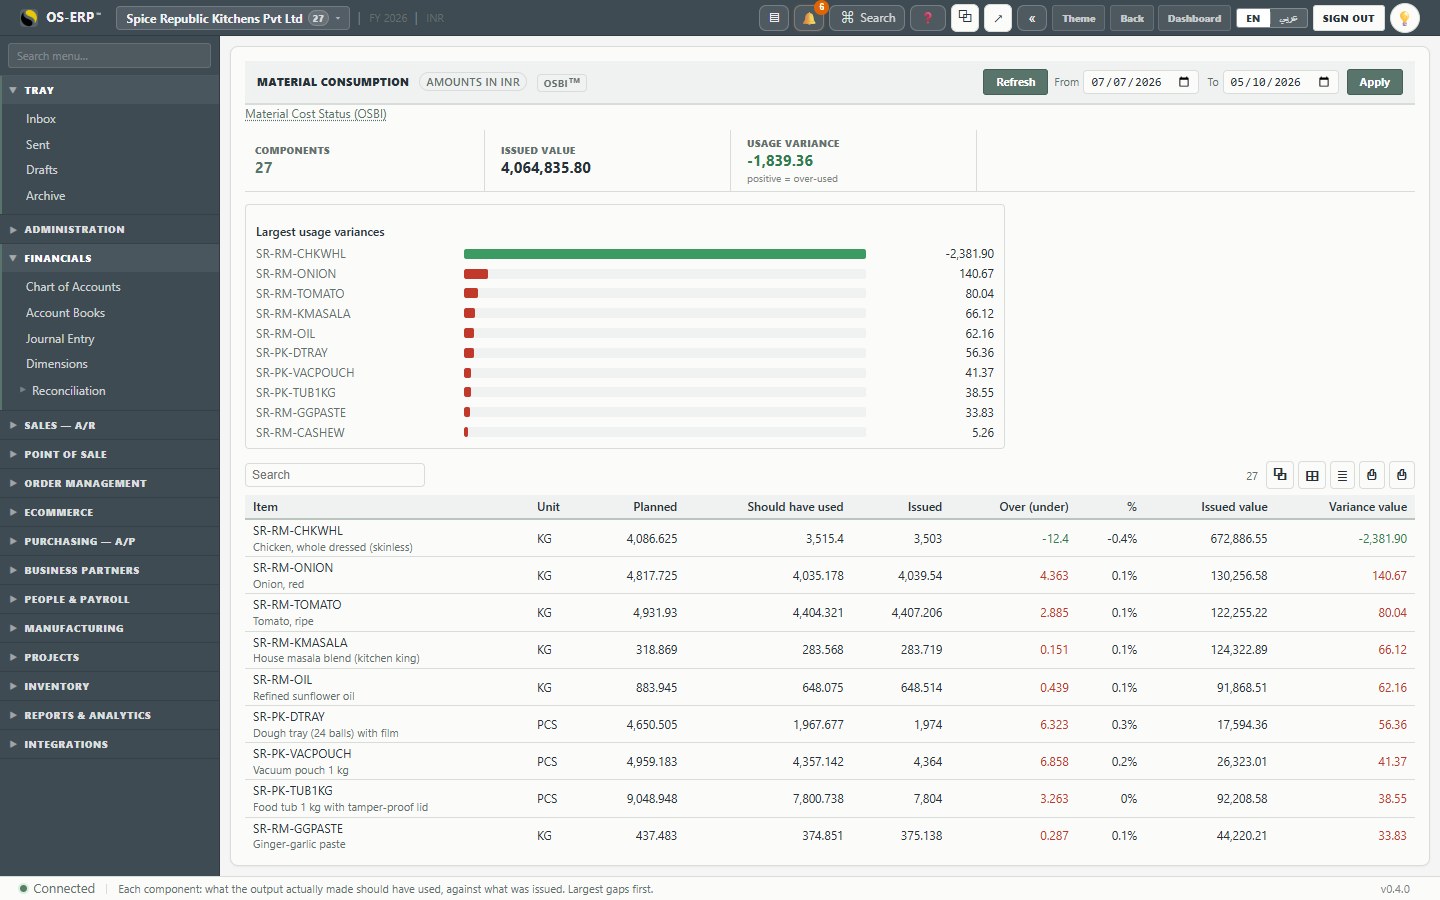
This week: actual issued INR 4,064,835.80 against a standard of INR 4,066,607.11, price variance +67.32, usage variance -1,845.57. The recipes match what the kitchen really uses to well within one per cent.
Every product code drills down into its material lines and every movement behind them:
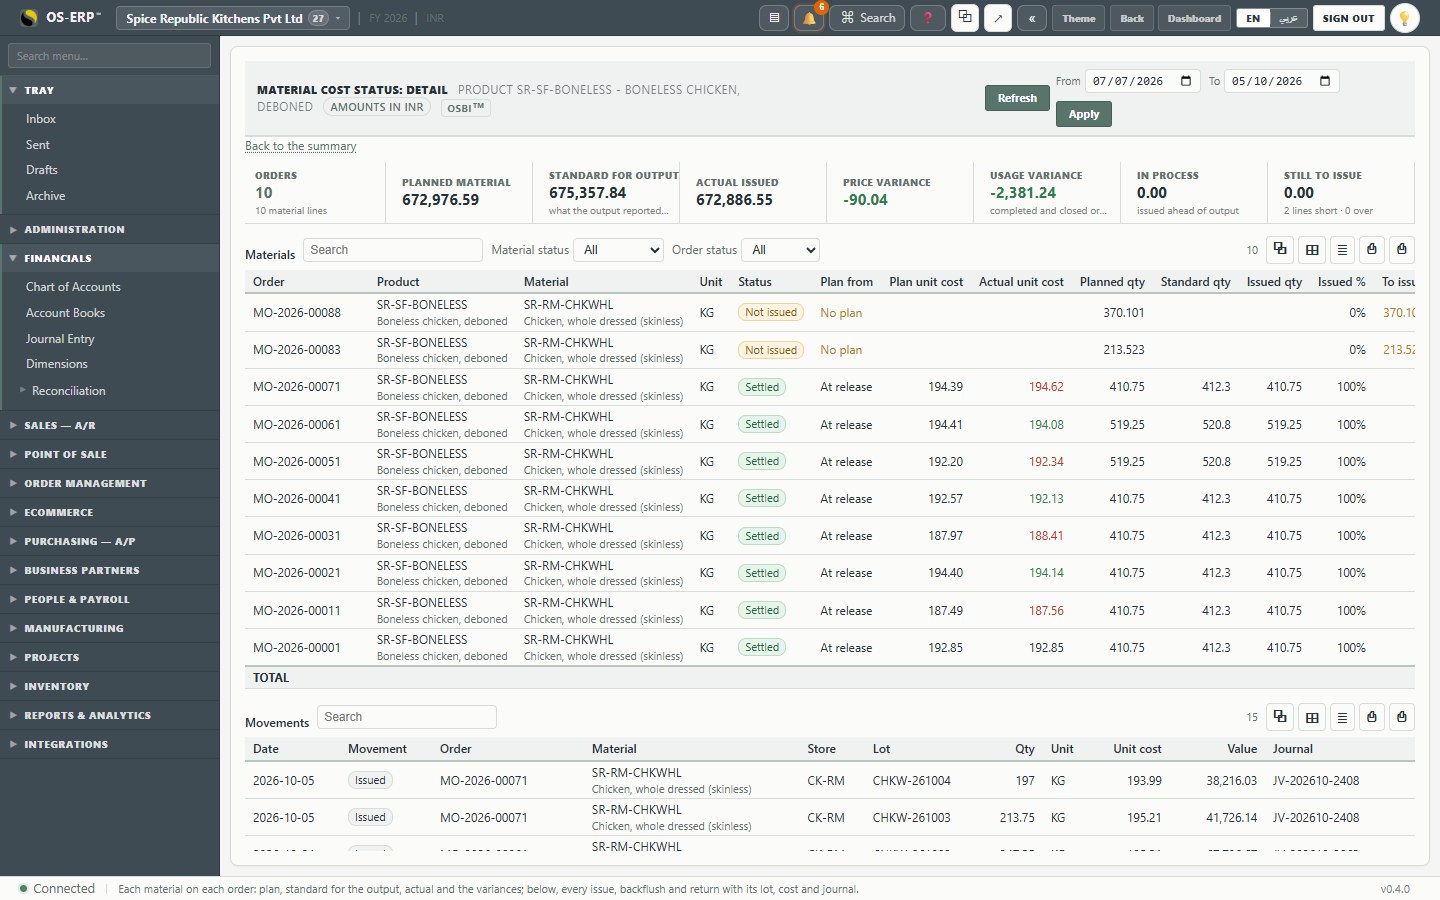
Each order's material line, then every issue, backflush and return with its store, lot, unit cost and journal. For boneless chicken, every deboning run was issued 410.75 or 519.25 kg of whole chicken against a standard of 412.3 or 520.8 kg: the butchers used slightly less than the recipe allows (usage variance -2,381), and the price variance (-90) is the farm's daily price. The two orders at the top are tomorrow's, not yet issued.
9.3 Work in progress ties to the books
Reports > Work in progress:
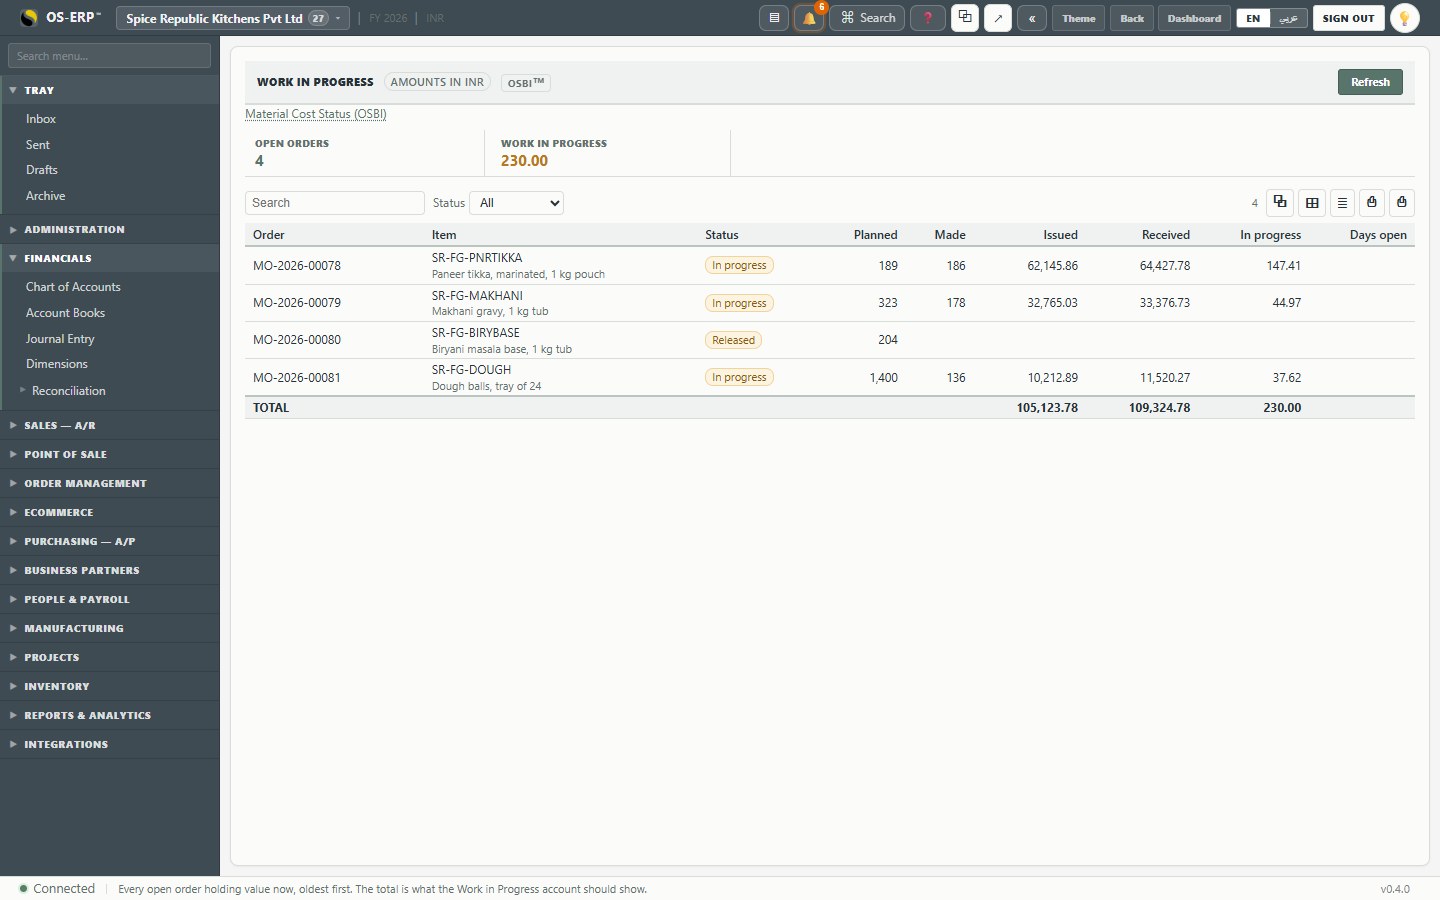
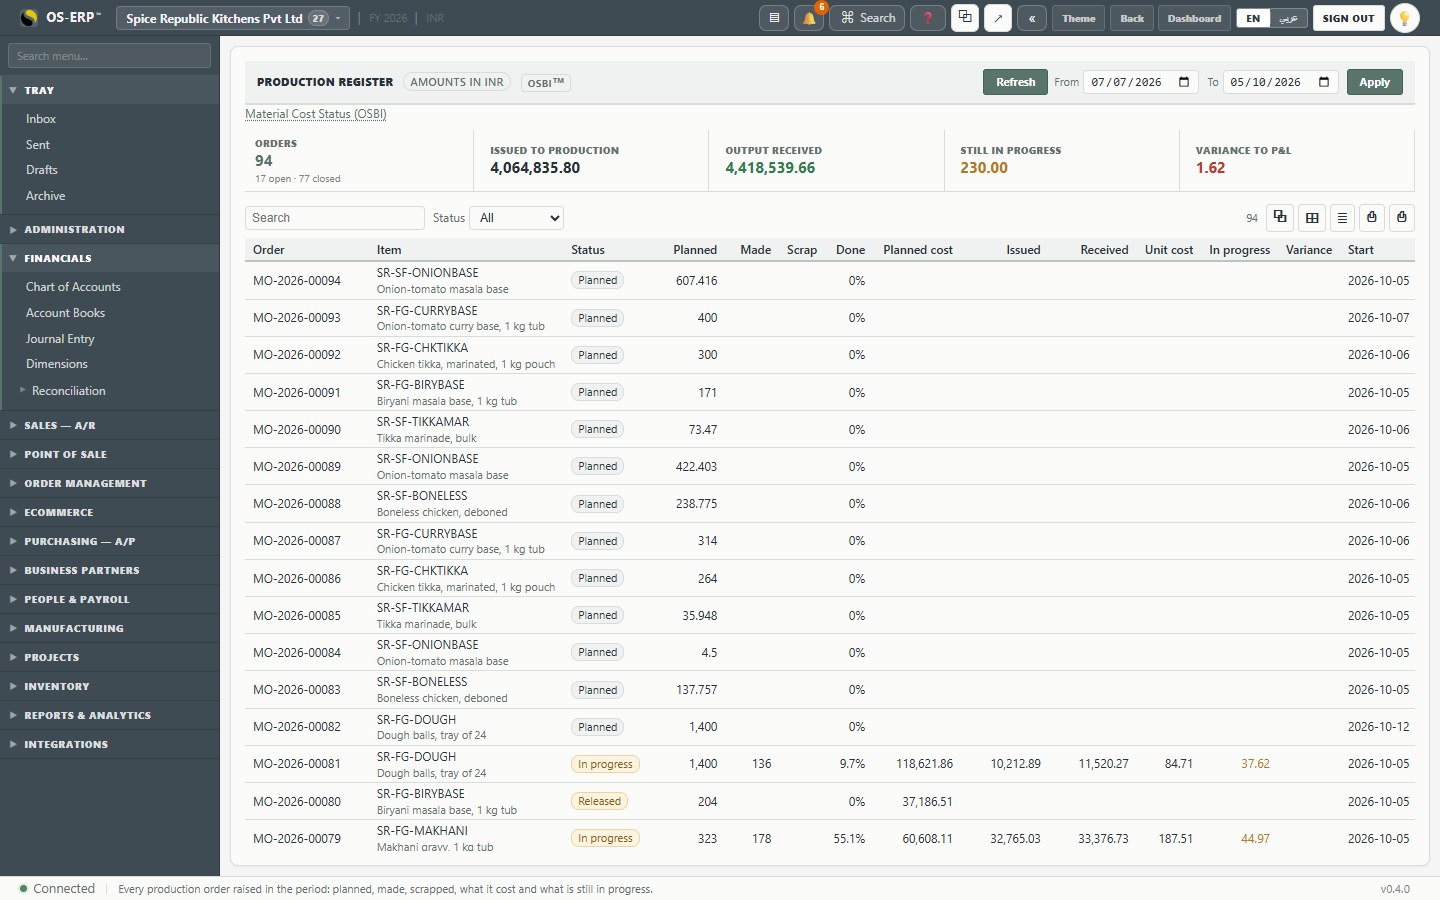
Only the orders on the floor right now hold work in progress: tonight's makhani (half made), the paneer tikka waiting for its inspection, the released biryani base and the dough line's weekly order. Its total equals the Work in Progress account in the general ledger, because every movement in and out of an order posts to that account and nothing else does. Closed orders hold exactly zero.
9.4 Consumption and the register
Reports > Consumption compares, per ingredient, what was issued with what the output should have used:
Reports > Production register lists every order in the period with its quantities and values:
9.5 Where the money went this week
Putting the reports together:
| INR | |
|---|---|
| Packs sent to outlets (12,763 packs, at cost) | 2,418,183.70 |
| Chicken bones sold on as a by-product (1,013 kg) | 40,500.00 |
| Production variance to profit and loss | 1.62 |
| Work in progress at the end of the week | 230.00 |
The pack cost includes the night shift's time at every station: the outlets are charged what their food really cost, not just its ingredients.